Nicht kategorisierte Dateien
Aus Eduwiki
Unten werden bis zu 50 Ergebnisse im Bereich 101 bis 150 angezeigt.
-
AB3 Schwellenwerte Anwenden.docx ; 1,78 MB
-
AB4 - Personensteckbrief.docx ; 184 KB
-
AB4 Schwellenwert Suchen.docx ; 1,9 MB
-
AB5-A - Rollenspiel.docx ; 285 KB
-
AB5-B - Rollenspiel.docx ; 286 KB
-
AB5-C - Rollenspiel.docx ; 286 KB
-
AB5-D - Rollenspiel.docx ; 286 KB
-
AB5-E - Rollenspiel.docx ; 286 KB
-
AB5 - Plakat.docx ; 289 KB
-
AB5b - Plakat.docx ; 289 KB
-
AB5c-A - Talkshow.docx ; 285 KB
-
AB5c-B - Talkshow.docx ; 286 KB
-
AB5c-C - Talkshow.docx ; 284 KB
-
AB5c-D - Talkshow.docx ; 285 KB
-
AB5c-E - Talkshow.docx ; 284 KB
-
AB6 Zweiter Datensplit.docx ; 97 KB
-
AB8 Blankokarten.docx ; 273 KB
-
AB Bilderkennung.pdf ; 625 KB
-
Abb12 Begriffsklärung.png 688 × 327; 52 KB
-
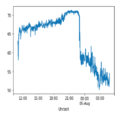
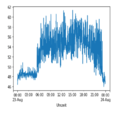
Abbildung 10- Zusammenfassung der Lärmdaten pro Minute.png 401 × 250; 27 KB
-
Abbildung 13- Arbeitsauftrag zu Google Trends Explorationen.png 645 × 466; 18 KB
-
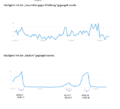
Abbildung 14- Grafik zum Suchbegriff Libori bei GoogleTrends.png 1.152 × 384; 18 KB
-
Abbildung 17- Erklärung der Datenerhebung mit der SenseBox.jpg 875 × 656; 93 KB
-
Abbildung 17- Erklärung der Datenerhebung mit der SenseBox .jpg 566 × 808; 86 KB
-
Abbildung 19- Steckbrief des Standorts A.png 826 × 1.169; 58 KB
-
Abbildung 20- Arbeitsauftrag zur Datenanalyse im Lärmprojekt.png 889 × 427; 43 KB
-
Abbildung 24- Reflexion des ersten Bausteins.png 1.213 × 709; 101 KB
-
Abbildung 3- Aufbau des im Projektkurs genutzten Messinstruments.png 1.385 × 325; 118 KB
-
Abbildung 4- Aufbau eines Jupyter Notebooks.png 1.333 × 750; 165 KB
-
Abbildung 5- Beschreibung des Lärmprojekts und der Lärmdaten.png 537 × 853; 181 KB
-
Abbildung 6- Das Dateneinlesen im Jupyter Notebook.png 910 × 644; 175 KB
-
Abbildung 7- Umrechnung des Zeitstempels.png 968 × 930; 127 KB


